R분석
ggplot2 basic
AIHYEONJI
2025. 2. 7. 17:00
install.packages("ggplot2")
library(ggplot2)
# ggplot basic
ggplot(data=airquality, aes(x=Day, y=Temp))
아래의 함수들을 사용하여 그래프를 채운다.
1. geom_point()
2. geom_line()
3. geom_bar()
# 기본적인 ggplot의 틀
ggplot(data=사용할 데이터, aes(x=x축 데이터, y= y축 데이터))+
 geom_사용함수()
# 누적 막대 그래프
ggplot(dataest, aes(x=factor(변수명))+
geom_bar(aes(fill=factor=(변수명2)))# 막대 그래프
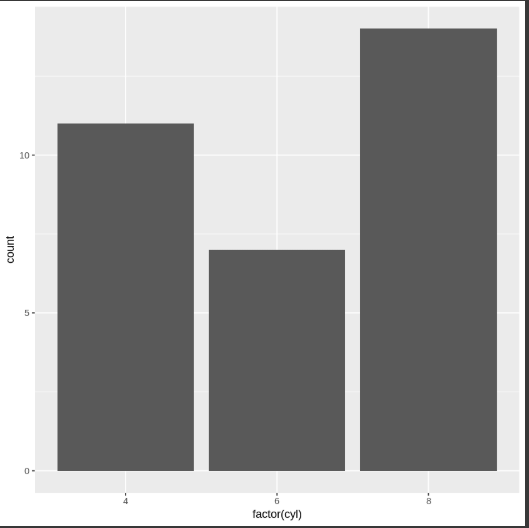
# 1.
ggplot(mtcars, aes(x=factor(cyl)))+
geom_bar()
# 2.
ggplot(mtcars, aes(factor(cyl)))+
geom_bar(fill=factor(gear)))